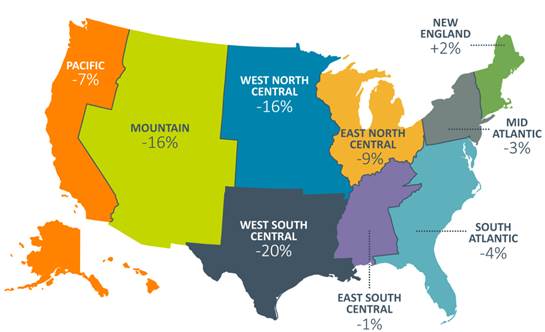
New International Enrollments Decline
Open Doors survey shows declines in new international students starting in fall 2016, after years of growth. This fall universities report an average 7 percent decline in new international students.
Top 15 Countries of Origin for International Students in the U.S.
| Country of Origin | Number of Students in 2016-17 | Percent Change From 2015-16 |
| 1. China | 350,755 | +6.8% |
| 2. India | 186,267 | +12.3% |
| 3. South Korea | 58,663 | -3.8% |
| 4. Saudi Arabia | 52,611 | -14.2% |
| 5. Canada | 27,065 | +0.3% |
| 6. Vietnam | 22,438 | +4.8% |
| 7. Taiwan | 21,516 | +1.8% |
| 8. Japan | 18,780 | -1.5% |
| 9. Mexico | 16,835 | +0.6% |
| 10. Brazil | 13,089 | -32.4% |
| 11. Iran | 12,643 | +3% |
| 12. Nigeria | 11,710 | +9.7% |
| 13. Nepal | 11,607 | +20.1% |
| 14. United Kingdom | 11,489 | -0.9% |
| 15. Turkey | 10,586 | -1% |
International Students in the U.S. by Field of Study
| Field of Study | Number of International Students, 2016-17 | Percent Change From 2015-16 |
| 1. Engineering | 230,711 | +6.4% |
| 2. Business and management | 200,754 | +0.2% |
| 3. Math and computer science | 167,180 | +18% |
| 4. Social sciences | 83,046 | +2.1% |
| 5. Physical and life sciences | 76,838 | +1.9% |
| 6. Fine and applied arts | 61,506 | +3% |
| 7. Health professions | 34,395 | +1.3% |
| 8. Intensive English | 30,309 | -25.9% |
| 9. Communications and journalism | 21,913 | +3.6% |
| 10. Education | 17,993 | -7.6% |
| 11. Humanities | 17,561 | -0.6% |
| 12. Legal studies and law enforcement | 15,306 | +1.5% |
| 13. Agriculture | 12,602 | +2.3% |
Fall Snapshot Data
I have no idea why Canada isn’t considered abroad in this survey 😉
Top 20 Destinations for American Students Studying Abroad
| Country | Total Number of Students, 2015-16 | Percent Change From 2014-15 |
| 1. United Kingdom | 39,146 | +2.5% |
| 2. Italy | 34,898 | +3.3% |
| 3. Spain | 29,980 | +5.8% |
| 4. France | 17,215 | -5.4% |
| 5. Germany | 11,902 | +8.1% |
| 6. China | 11,689 | -8.6% |
| 7. Ireland | 11,071 | +8.2% |
| 8. Australia | 9,536 | +8.2% |
| 9. Costa Rica | 9,234 | -0.8% |
| 10. Japan | 7,146 | +18.1% |
| 11. South Africa | 5,782 | +10.2% |
| 12. Mexico | 5,179 | +9.9% |
| 13. Denmark | 4,632 | +14.8% |
| 14. Czech Republic | 4,610 | +12.6% |
| 15. India | 4,182 | -5.8% |
| 16. Argentina | 3,847 | +3.7% |
| 17. New Zealand | 3,807 | +14.5% |
| 18. Cuba | 3,782 | +58.6% |
| 19. Ecuador | 3,751 | +0.1% |
| 20. South Korea | 3,622 | +2.9% |
Stephen

0 Responses
Stay in touch with the conversation, subscribe to the RSS feed for comments on this post.