
Why care about them? They’re like treasure maps guiding us through possibilities, helping us estimate outcomes and make informed decisions—our superpower for managing risks and optimizing processes!
Key concepts:
1️⃣ Random Variables: These are the outcomes of uncertain events, like the number you roll on a dice.
2️⃣ Probability Density Function (PDF): Think of the PDF as a graph showing the likelihood of a continuous variable (like time) taking on a specific value.
3️⃣ Cumulative Distribution Function (CDF): The CDF shows the probability that a random variable is less than or equal to a specific value, guiding us in assessing event probabilities.
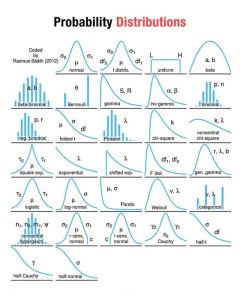
4️⃣ Common Distributions: Different distributions have unique traits:
Normal: Bell curve
-Binomial: Yes-no scenarios
-Poisson: Counting events
-Exponential: Waiting times
-Uniform: Equal likelihood of outcomes
5️⃣ Central Limit Theorem: This theorem states that averaging many independent variables tends to create a normal distribution, the famous bell curve.
Understanding probability distributions helps us predict the future, measure uncertainty, and gain insights from data. Whether in building models, analyzing risks, or studying trends, probability distributions are essential tools.”
Other useful Visuals


0 Responses
Stay in touch with the conversation, subscribe to the RSS feed for comments on this post.